
Memory Management and Query Density: Designing Snowflake for Interactive Analytics
William McKnight and Jake Dolezal
TL;DR:
- At the same hourly cost, Snowflake Interactive Analytics completed 100% of 10,865 queries from 1 to 32 concurrent users on its smallest warehouse, with zero failures.
- ClickHouse Cloud failed 20.5% of queries at 24 users and 58% at 32. Every failure was MEMORY_LIMIT_EXCEEDED.
- At 32 users, Snowflake delivered nearly 6x the successful queries of ClickHouse: about 960 vs. 163 in five minutes.
- ClickHouse gave no warning: zero errors at 16 users, then one in five queries failed at 24.
A team from another department asks, “Can we be given access to your dashboard?”
It is a reasonable request with an uncomfortable answer. Currently, the dashboard works well. It is eight tiles, most of them a variation on “how many distinct customers, orders, sessions or trades in the last thirty days.” Your team has been on it for months. The error rate is zero, the tiles populate in well under a second, and there have been no performance issues. So you say yes. Then you are asked about a third team, and a fourth, and at some point the honest answer is that you do not know, because nothing you can see is telling you how close you are to the performance edge.
This post is about that gap. Query density is how much concurrent dashboard traffic a fixed amount of compute will carry before the answers stop arriving. We ran the same memory-heavy mix against Snowflake and ClickHouse at the same hourly price and added concurrent users one step at a time until something broke:
- How many of those users does a given configuration actually serve?
- What happens at the ceiling: do queries get slower, or do they stop coming back?
- What does a successful query cost once some of them are failing?
Why this scenario
Capacity planning for an interactive workload is usually done with the wrong variable. The instinct is to reason about data volume and scan speed. For a dashboard mix, the binding constraint is how much aggregation state the engine has to hold, multiplied by how many people are asking at once, and that combination behaves in ways that are easy to get wrong:
- The working set is invisible from the SQL. COUNT(DISTINCT trade_id) is nine words whether the column holds a thousand values or a billion. Nothing in the query text tells you how much memory it will need.
- Concurrency multiplies the state, not the scan. Ten users running the same distinct count do not share one hash set. They build ten of them, at the same time, on the same node.
- Not every overflow has an escape hatch. Spilling to disk is the standard answer to an aggregation that does not fit, and it works well for GROUP BY. It does not exist for a global exact distinct count, for reasons we come back to below.
- Failure is binary. A dashboard tile that is slow is an annoyance. A tile that returns MEMORY_LIMIT_EXCEEDED is an incident, and it looks identical to an outage to the person looking at it.
- The usual warning signs come too late. Error rate, latency and throughput tell you how the engine handled past load, not how much more it can take. In our ClickHouse test, all three looked healthy right up until queries started failing.
Three things that make a dashboard mix expensive
- Aggregation state scales with distinct values, not with rows returned. An exact COUNT(DISTINCT trade_id) over a month of trading returns one row and holds every trade identifier it saw while it works. The size of the answer tells you nothing about the cost of getting it.
- A global exact distinct count cannot spill. External aggregation works by partitioning the GROUP BY key space, writing finished partitions to disk and keeping only the active one in memory. A COUNT(DISTINCT x) with no GROUP BY has no key space to partition. In ClickHouse, uniqExact must hold the whole set in RAM at any spill setting. This is not a tuning oversight; there is nothing to tune. Raise max_bytes_before_external_group_by as high as you like.
- Density is set by the heaviest tier, not the average. A dashboard mix is never uniform. If two tiles in ten are heavy, those two decide how many users the configuration serves, because they are the ones holding memory when the next request arrives.
Our Central Focus
We framed the following questions to test the two platforms:
- How many concurrent users does each engine serve at the same hourly cost? Measured as successful queries per second, so a failure counts for nothing.
- What happens at the ceiling? Does the engine turn excess load into latency, or into errors?
- Which queries break first, and could you have predicted it? Peak memory per query, measured, against the error that eventually arrives.
- What does a successful query cost? Compute spent on queries that failed is still compute you paid for.
The Test
We built the test around stock-exchange trade data: one row per execution, with the trade, the account, the symbol, the venue, the side, the price, the volume, the notional, the volatility, an execution reference and an execution timestamp. This is the same corpus as the first post in this series, which is deliberate. The subject here is aggregation memory under concurrency, so reusing data whose cardinality and skew we have already characterized means the only things that changed are the query mix and the number of people running it.
- 1.5 billion trades. Three years of history. Time windows are anchored to absolute dates inside that range rather than to the current date.
- Same data. Both engines hold 1,500,000,000 rows. The five nullable measure columns are stored as Nullable on ClickHouse and their per-column NULL counts match Snowflake exactly, so neither engine is quietly aggregating zeros where the other aggregates nothing.
- Matched physical layout. For Snowflake, an interactive table with CLUSTER BY (TRADE_DATE, TRADE_ID). For ClickHouse, a SharedMergeTree with ORDER BY (exec_ts, trade_id). Each engine filters on its own leading key, so the row sets are identical and both engines prune.
- Result caching off on both. Every query does real work.
The query mix is seven queries in a twenty-slot weighted mix, shuffled, weighted about 65% heavy, 20% medium and 15% light. All seven are aggregations and distinct counts. There are no joins, no CTEs and no window functions, which is a deliberate limit we return to at the end.
Heavy tier (65% of the mix)
- B3-H1: “How many distinct trades did we execute in the last 30 days?” An exact global distinct count on the highest-cardinality column in the table.
- B3-H2: “How many distinct execution references in the quarter?” The same shape over a 90-day window.
- B3-H3: “Distinct accounts, symbols, venues and sides over the quarter.” Four exact distinct counts of very different cardinality in a single statement.
Medium tier (20% of the mix)
- B3-M1: “Top 100 accounts by traded volume this month.” A high-cardinality GROUP BY, which is the shape that can spill.
- B3-M2: “Volume and average volatility by symbol this month.”
Light tier (15% of the mix)
- B3-L1: “How many trades are in the table?” Answered from metadata on both engines.
- B3-L2: “One symbol’s activity this month.” A bounded point filter.
Compute Cost
We designed the test for an equivalent compute cost across the two platforms.
| ClickHouse | Snowflake | |
|---|---|---|
| Account Tier | Scale ($0.2985/8GiB/hour) | Standard ($2.00/credit/hour) |
| Compute | 2 replicas x 16 GiB each | 1 X-Small Interactive Warehouse |
| Serving Cost | $1.19/hour | $1.20/hour |
| Memory Ceiling | Full 16 GiB per replica, no per-user cap, service-default spill settings | Five-second per-query interactive ceiling, Standard X-Small, only used by <1% of executions across the entire test |
The Harness
A closed-loop, rising-concurrency sweep, the same harness used in the earlier posts in this series:
- Concurrency levels 1, 2, 4, 6, 8, 10, 12, 16, 24 and 32. At each level, users run the mix simultaneously with no think time. Each issues its next query the instant the previous one returns.
- 300 seconds per level, with in-flight queries allowed to finish.
- Metrics captured. Attempts, errors and error class, successful queries per second, and p50 / p95 / p99 latency. On ClickHouse we also capture peak memory per query from system.query_log.
How to Read the Results
- Error rate is the metric that matters once failures start. A query that fails returns nothing. It does not contribute to throughput, its latency is not worth measuring, and when two engines complete different fractions of the same workload they cannot be compared on anything else.
- Throughput here is successful queries per second. Failures are already excluded. That is the honest version, but note the perverse incentive it creates: an engine that fails fast can look busier than one that is working.
- Latency comparisons only hold in the band where both engines completed everything. In this test that band is c=1 through c=16.
- Cost is counted per query. A query that consumed memory and then failed still cost you the compute.
Results
Snowflake Interactive Analytics completed every query at every concurrency level: 10,865 executions with zero capacity failures on the smallest interactive warehouse it offers. ClickHouse, on cost-matched hardware with the full 16 GiB of each replica available to it, was clean through 16 users and then hit a wall.
Figures 1-3. Test results by concurrency. Failure rate, median latency, successful query completion, throughput, and cost with a ClickHouse failure threshold added for reference
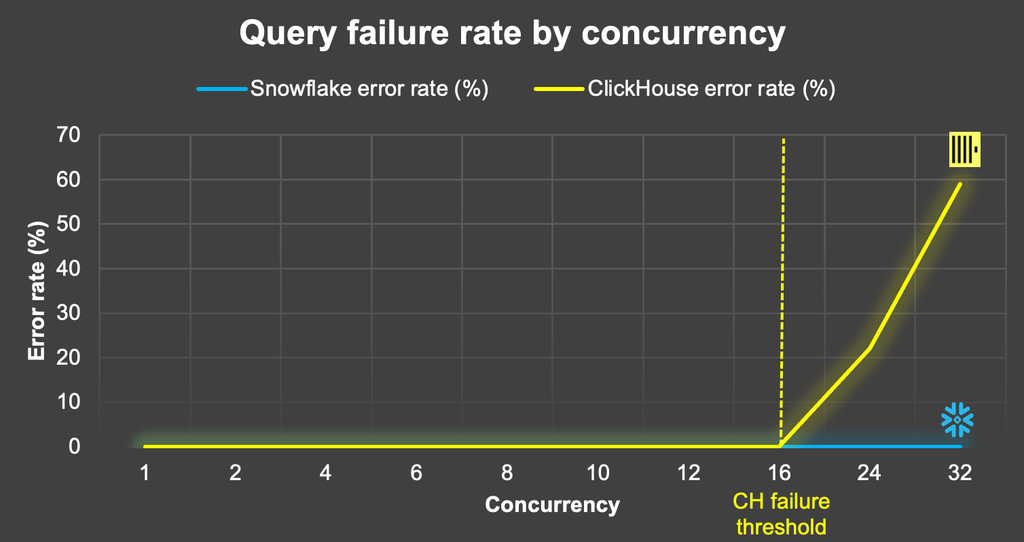
Figure 1. Query failure rate by concurrency.
Snowflake’s error rate is flat at zero across the sweep, indicating no failed queries at any concurrency level. ClickHouse is flat at zero to c=16 and then grows exponentially. The shape of the ClickHouse curve is the part worth dwelling on. It is not a gradual degradation. With 16 users, the service is error-free, but you don’t know you are close to the edge. One step later, a fifth of the workload is gone, and two steps later more than half of it is.
That is what an unspillable aggregation looks like from the outside. Up to the point where the concurrent working sets fit in a replica’s memory, everything is fine. Past it, queries fail. There is no intermediate state in which ClickHouse serves the heavy tier slowly.
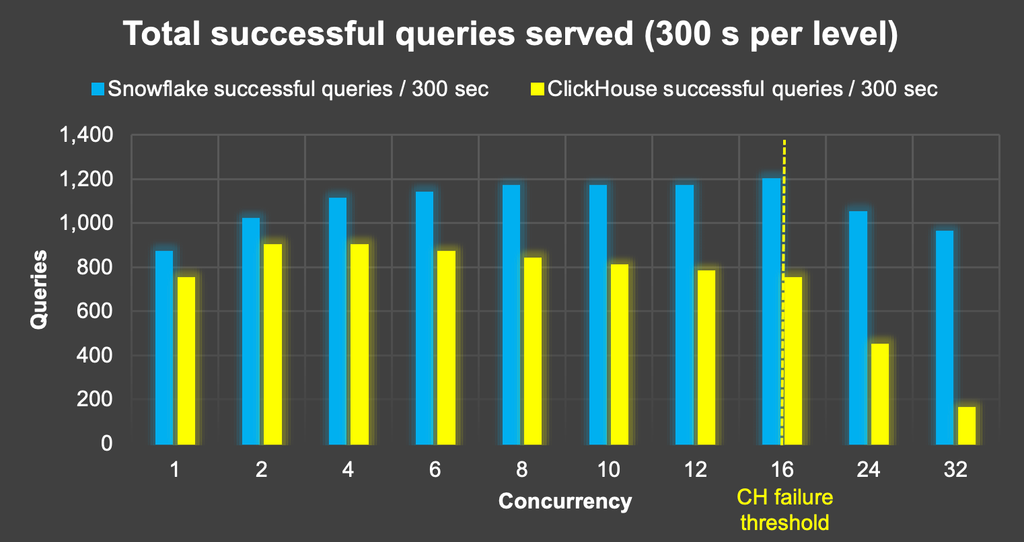
Figure 2. Total successful queries served.
Snowflake’s best level is 16 users, at about 1,200 queries in five minutes. ClickHouse’s best is 2 to 4 users, at about 900, and from there it declines at every step while the offered load keeps rising. At 32 users, Snowflake serves about 960 and ClickHouse about 163.
What it Costs
Both configurations cost about $1.20 an hour whether they are serving queries or, in ClickHouse’s case, failing them. Dividing that fixed cost by the queries that actually succeeded is what separates them. Storage is excluded on both sides.
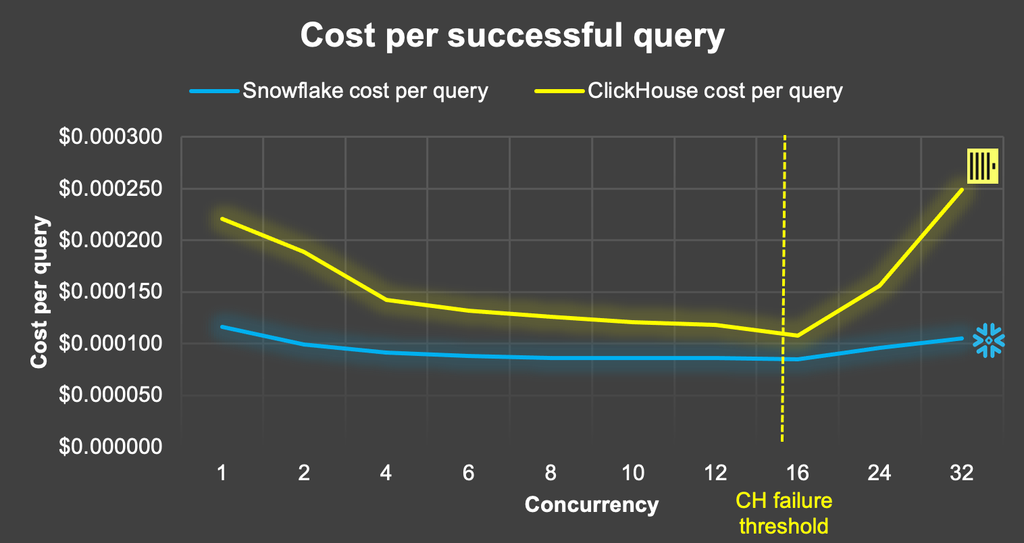
Figure 3. Cost per successful query.
Both curves fall to 16 users and rise after it, which is the expected shape as a fixed hourly cost is divided by rising throughput. Snowflake’s cost per query rises slightly at 24 and 32 users as its throughput starts to decrease somewhat. ClickHouse’s cost rises significantly because a growing share of the compute you are paying for is being spent on queries that end in an error.
Lessons Learned
- A zero error rate does not mean you have extra headroom. ClickHouse ran this mix at eight consecutive concurrency levels with zero failures and then lost a fifth of the workload at 24 users. If your capacity planning is based on “it has not failed yet”, you do not know where the edge is. Nothing in latency or error rate moved before the edge arrived.
- Some aggregations have no overflow path at all. Spilling is the standard safety valve and it is a good one, but it applies to shapes with a key space to partition. A global exact distinct count has none. Before you rely on spill as your memory strategy, check which of your queries it can actually apply to.
- Flat throughput is a design, not a defect. Snowflake’s single X-Small did not go faster as users arrived. It also did not go backwards, and it never returned an error. For a serving tier, bounded and predictable is usually the property you want.
Conclusion
At 1.5 billion rows and matched hourly cost, Snowflake Interactive Analytics completed all 10,865 executions across ten concurrency levels on the smallest warehouse it offers. ClickHouse Cloud, given the full memory of both replicas and no per-user cap, matched it through c=16 and then failed 20.5% of the workload at c=24 and 58% at c=32, every failure a MEMORY_LIMIT_EXCEEDED.
Both engines are working on the same data with similar per-query memory, and in the clean band the gap in median latency is 4.2 seconds against 5.8. The advantage is what happens at the boundary. Snowflake bounds each query at five seconds and hands anything longer to a standard warehouse, converting an overrun into an answer. ClickHouse is bounded by the memory of a single replica, and when a global exact distinct count does not fit, there is no spill path, no degraded mode and no slower answer. There is an error.
The practical form of that question is the one we opened with. Can another team have access to your dashboard without causing performance problems? On this workload, at this price, Snowflake answered yes at every level we tested. ClickHouse answered no at 24 concurrent users. If your dashboards are built on aggregations like distinct counts, the question worth asking of your engine is not how fast the query runs, but what happens when the aggregation does not fit. If that is a question you are currently answering by over-provisioning, try Snowflake Interactive Analytics.
FAQ
How does Snowflake Interactive Analytics and ClickHouse handle high concurrency workloads?
In our test, Snowflake’s smallest Interactive warehouse (X-Small) served every concurrency level we tried, up to 32 simultaneous users, with zero failed queries on 1.5 billion rows. ClickHouse Cloud, at the same hourly cost, started failing at 24 users.
Why does ClickHouse fail with MEMORY_LIMIT_EXCEEDED on dashboards?
Exact distinct counts in ClickHouse (uniqExact) must hold every value in memory, and a global COUNT(DISTINCT) can’t spill to disk. As more users run these queries at once, the combined memory exceeds a replica’s limit and queries fail outright instead of slowing down.
What happens when a Snowflake Interactive query runs past 5 seconds long?
Snowflake answers it anyway. Queries longer than five seconds are handed to a Standard fallback warehouse, so an overrun becomes a slower answer rather than an error. Fewer than 1% of executions in our test needed it.
Is Snowflake cheaper per query than ClickHouse for concurrent dashboards?
Snowflake is cheaper per successful query than ClickHouse once concurrency rises past 16 users. Both cost about $1.20/hour, but Snowflake keeps returning answers as users are added. ClickHouse spends a growing share of that same compute on queries that end in errors, so its cost per successful query climbs sharply past 16 users.
Can I tell when ClickHouse is about to run out of headroom?
ClickHouse Cloud gives administrators real visibility into memory. Cloud monitoring dashboards show memory utilization and query concurrency, ‘system.processes’ reports memory for running queries, and ‘system.query_log’ records peak memory per completed query (we used it in this test). Alerts can be built on these. What the metrics don’t give you is a safe user count. Exact distinct-count queries can’t spill to disk, so failure depends on how many heavy queries happen to overlap at the same moment, which turns per-query memory into a moving target. In our test, ClickHouse ran with zero errors through 16 concurrent users and then failed a fifth of queries at 24. Snowflake Interactive Analytics doesn’t depend on this kind of monitoring to avoid failures, because queries that run long complete on a fallback warehouse instead of returning an error.
Methodology notes
Snowflake Interactive X-Small warehouse on AWS us-west-2 at Standard edition pricing, one cluster, result cache disabled. A Standard X-Small fallback warehouse was attached for the scored runs; 0.57% of executions across the sweep were served by it, and the figures above are reported as measured with that fallback in place. Because a Snowflake Interactive warehouse enforces its five-second ceiling on execution rather than on wall time, median latencies above five seconds reflect queue time and fallback execution, not interactive execution. ClickHouse Cloud Scale tier, AWS us-west-2, two replicas of 16 GiB with automatic idling disabled during runs, memory uncapped per user and the service-default spill thresholds (8 GiB for external aggregation and external sort) left in place; those thresholds are not reachable by a global exact distinct count, which is the shape that fails. A capped-memory variant of the ClickHouse configuration was tested and retracted as not comparable. The mix is seven aggregation and distinct-count queries in a twenty-slot weighted, shuffled rotation; it contains no joins, CTEs or window functions, so these results speak to aggregation memory under concurrency and not to query complexity in general. Each level is a single 300-second run.
