
Window Functions at Interactive Latency: Year-over-Year Sales on Snowflake and ClickHouse
William McKnight and Jake Dolezal
TL;DR:
- On a 16-tile window-function dashboard over 1.5 billion order lines, Snowflake Interactive Analytics was faster than ClickHouse Cloud on all 16 queries, by up to 5.2x.
- With one user, Snowflake’s median latency was 0.37 seconds compared to ClickHouse’s 1.60 seconds, 4.3x faster.
- At the same base hourly cost, Snowflake served twice the throughput of ClickHouse: 2.95 queries per second vs. 1.45.
- At 32 concurrent users, Snowflake’s median latency stayed under 5 seconds, while ClickHouse’s climbed past 20 seconds.
- Snowflake needed no memory or spill configuration. ClickHouse required memory limits and spill thresholds set by hand.
It is the second week of December and the merchandising team, regional managers, and finance are all over the holiday dashboard. How is this December tracking against last December? Which customers are spending more than they did a year ago? What does the cumulative revenue curve look like? Is today an outlier against the past week?
Every one of those tiles is a window function: LAG and LEAD across years, a running SUM, a RANK or NTILE, a sliding seven-day window. And every one of them is re-run each time someone changes a filter or a page refreshes.
- Does each tile come back in about a second?
- Does it keep coming back in about a second when several people open the dashboard at once?
- Do any of the tiles break?
On Snowflake, an Interactive warehouse serves the dashboard from an interactive table and manages its own memory. Queries that run past its five-second limit move to a standard fallback warehouse instead of failing. On ClickHouse Cloud, window state lives in each replica’s memory, bounded by per-query limits and spill thresholds that an operator sets and keeps sized as concurrency grows.
Why this scenario
Period-over-period comparison is the most common analysis in retail, ecommerce, financial applications, ad-tech, fin-tech and many other business context, and it is almost always written with window functions. What makes it demanding is not the size of any single query but how the queries are used:
- The dashboard is interactive. An analyst changing a filter expects the tile to redraw immediately.
- The queries arrive together. A dashboard page fires a dozen tiles at once, and several people open it at the same time.
- The working set is detail, not aggregates. A window function cannot aggregate away detail before it sorts, so a per-customer ranking holds millions of rows in memory where a per-channel trend holds a few hundred.
Where the memory goes
Window functions partition, sort, and then compute over a frame of rows. The memory they need depends on the grain of the partition:
- Channel and date grain. A running total of daily revenue by channel works on a few hundred pre-aggregated rows. It is cheap on any engine
- Customer grain. Ranking the top customers per country, or comparing each customer’s spend year over year, has to sort millions of per-customer rows before the window can be evaluated
- Concurrency multiplies both. Every user running a customer-grain tile at the same time holds that state at the same time
With Snowflake, a warehouse uses the memory it has and spills to local and then remote storage if it ever needs more. ClickHouse holds window and aggregation state in a replica’s memory up to a per-query limit, and spills sorts and GROUP BYs to disk only past set thresholds.
Our Central Focus
We framed the following questions to test the two platforms:
- How fast is a single tile? Median latency of each of the 16 queries with one user
- How does latency hold as users are added? p50 and p95 latency from 1 to 32 concurrent users
- How much memory tuning does each engine need? The settings each engine required, and the memory and spill each one actually used under load
The Test
We built the test around retail order data: one row per order line item, with the customer, product, category, channel, destination country, quantity, and revenue.
- 1.5 billion order lines. Three years of history (January 1, 2019 to December 30, 2021), 42.6 million customers, 1.5 million products, 8 channels and 32 destination countries. December 2021 alone is 46 million order lines from 3.6 million customers
- One snapshot, two engines. Both engines were loaded from the same Parquet export of the same Snowflake table, and we checked 21 aggregates (row counts, distinct counts, sums, NULL counts, date range) to confirm they hold identical data
- Matched physical layout. For Snowflake, an interactive table with CLUSTER BY (ORDER_DATE, CUSTOMER_ID). For ClickHouse, a SharedMergeTree with ORDER BY (order_date, customer_id). Neither engine gets a layout advantage
- Result caching off on both. USE_CACHED_RESULT = FALSE on Snowflake and use_query_cache = 0 on ClickHouse, so every query does real work
The query mix is a 16-tile dashboard in four families of window functions. Every query is scoped the way a dashboard is scoped (December, or the fourth quarter, of 2021, and the same period of 2020 for year-over-year tiles), and every query returns identical results on both engines, row for row. Because the data ends on December 30, every year-over-year query compares December 1 to 30 in both years.
Family A: Period-over-period comparison
- B5-A1: December daily revenue by channel, each day against the same day last year (LAG over year)
- B5-A2: December year-over-year revenue growth rate by country
- B5-A3: Top 100 customers by increase in December spend over last year (LAG and LEAD per customer). Customer grain
- B5-A4: December daily revenue by channel, each day against the same day a week earlier and a week later (LAG and LEAD over seven days)
Family B: Running totals and cumulative curves
- B5-B1: Fourth-quarter running total of daily revenue by channel
- B5-B2: December daily rollup by channel with a rank and a running total
- B5-B3: December cumulative new customers by day
Family C: Ranking and distribution
- B5-C1: Top 5 customers per country by December spend (RANK). Customer grain
- B5-C2: Quartiles of December customer spend (NTILE), summarized per quartile. Customer grain
- B5-C3: Cumulative distribution of fourth-quarter daily revenue per channel (CUME_DIST)
- B5-C4: Top 3 revenue days per channel in the fourth quarter (ROW_NUMBER)
- B5-C5: Top 10 customers per channel by December spend (ROW_NUMBER on Snowflake, native LIMIT 10 BY on ClickHouse). Customer grain
Family D: Moving averages and frames
- B5-D1: Fourth-quarter 7-day moving average of daily revenue by channel (ROWS frame)
- B5-D2: 30-day trailing revenue through the fourth quarter (RANGE frame on date)
- B5-D3: Fourth-quarter average over the preceding three dates
- B5-D4: Fourth-quarter leave-one-out 7-day average by channel, for anomaly detection
Where the dialects differ, each engine uses its own syntax: QUALIFY on Snowflake against a subquery wrapper on ClickHouse, and ClickHouse’s native LIMIT BY for B5-C5, which is the shape most favorable to ClickHouse in the mix.
Compute Cost
| ClickHouse | Snowflake | |
| Account tier | Scale ($0.2985/8 GiB/hour) | Standard ($2.00/credit) |
| Configuration tested | 2 replicas: 4 vCPU / 16 GiB each | Interactive X-Small, 1 cluster |
| Cost per hour | $1.19/hour | 0.6 credits = $1.20/hour |
| Fallback warehouse | N/A | Standard X-Small, 1 credit = $2.00/hour, billed only while running |
The two base configurations cost the same per hour, so throughput compares directly. The fallback warehouse is billed separately, only when it runs. The fallback warehouse is part of the Snowflake configuration and is charged only when it runs.
The Harness
A dashboard is a closed loop: each user waits for a tile before asking for the next one. We modeled it that way.
- Closed-loop users. Each simulated user runs the next query in the mix as soon as the previous one returns. We stepped through 1, 2, 4, 6, 8, 10, 12, 16, 24 and 32 concurrent users, five minutes at each level
- Same mix. All 16 queries at equal weight, shuffled in a fixed-seed order, so both engines see the same sequence
- Warm start. One unmeasured pass of all 16 queries before each sweep, on both engines
- Three repetitions. Each configuration ran the full sweep three times, after a smoke run to validate the harness. The load generator ran on an EC2 instance in the same AWS region (us-west-2) as both services
How to Read the Results
- Latency is wall-clock time at the client, from sending a query to receiving its last row
- Throughput counts successful queries per second. Neither engine failed a single query in any run
Results
At the concurrency a dashboard actually generates, Snowflake was faster on every query in the mix, by 1.2 to 5.2 times. With one user, Snowflake’s median was 0.37 s against ClickHouse’s 1.60 s, and it stayed faster at every level we tested.
| Snowflake Interactive X-Small | ClickHouse 2 x 16 GiB | |||||
| Users | QPS | p50 | p95 | QPS | p50 | p95 |
| 1 | 2.06 | 0.37 s | 1.07 s | 0.72 | 1.60 s | 2.62 s |
| 2 | 2.83 | 0.58 s | 1.69 s | 1.08 | 1.65 s | 3.82 s |
| 4 | 2.95 | 1.08 s | 3.10 s | 1.38 | 2.68 s | 6.25 s |
| 6 | 2.93 | 1.58 s | 4.80 s | 1.48 | 3.70 s | 8.04 s |
| 8 | 2.95 | 2.20 s | 7.13 s | 1.49 | 4.83 s | 10.60 s |
| 10 | 2.95 | 2.92 s | 7.23 s | 1.50 | 6.12 s | 11.76 s |
| 12 | 2.96 | 3.70 s | 7.32 s | 1.49 | 7.50 s | 14.40 s |
| 16 | 2.95 | 4.62 s | 10.46 s | 1.48 | 9.70 s | 20.05 s |
| 24 | 2.97 | 4.86 s | 16.74 s | 1.47 | 15.27 s | 28.07 s |
| 32 | 2.95 | 4.90 s | 23.54 s | 1.45 | 20.87 s | 36.59 s |
Table 1. Throughput and latency by concurrent users, mean of three repetitions. 26,042 Snowflake and 12,475 ClickHouse queries, zero failures on either engine.
Snowflake served about 2.95 queries per second once it was busy, twice ClickHouse’s 1.45, on the same base hourly price. Up to four users, every Snowflake query completed on the Interactive warehouse with no fallback, at a p95 of 3.10 s against ClickHouse’s 6.25 s.
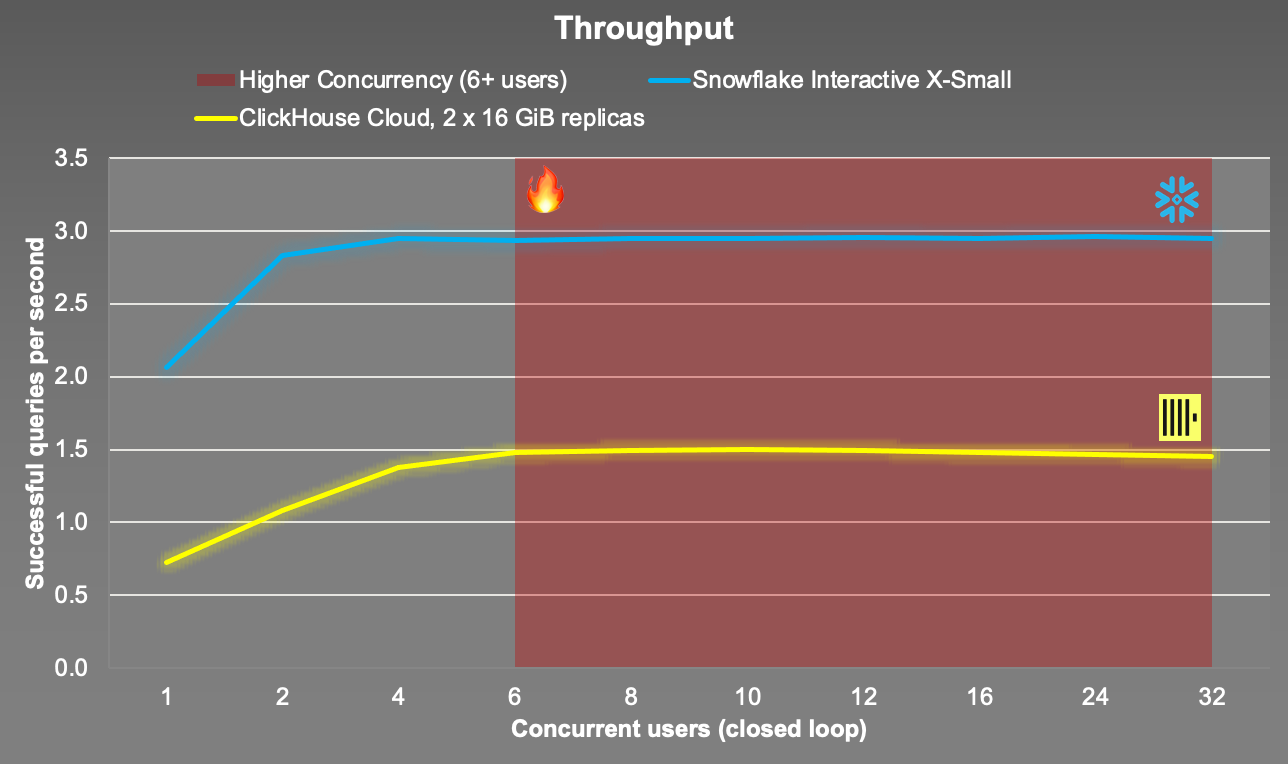
Figure 1a. Throughput as users are added. Successful queries per second.
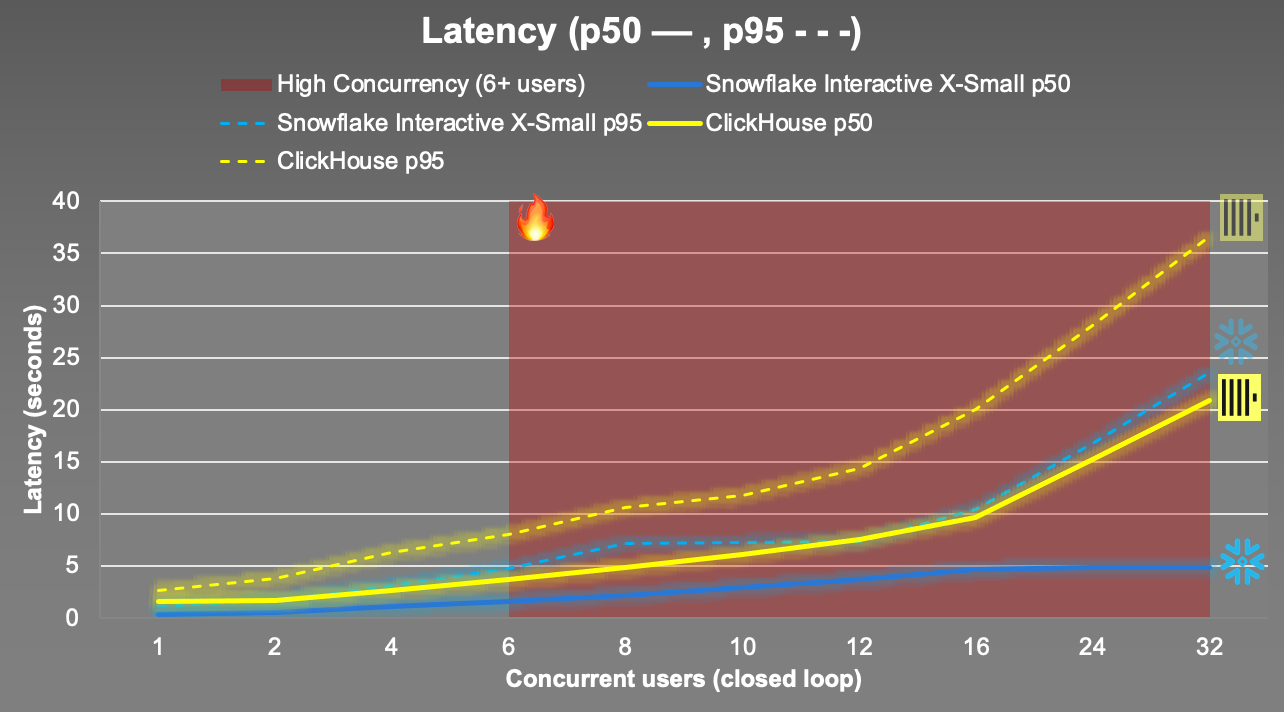
Figure 1b. Latency as users are added. p50 (solid) and p95 (dashed) latency. The shaded band is where Snowflake begins sending overflow to its fallback warehouse.
Both engines reach their capacity at four to six users; what differs is what happens after that. On ClickHouse, additional users wait in line: median latency grew steadily to 20.87 s at 32 users. On Snowflake, a query that would have waited past five seconds moved to the fallback warehouse and completed there, so the median leveled off just under five seconds (4.90 s at 32 users) and p95 was 23.54 s against ClickHouse’s 36.59 s.
Query by query, Snowflake was faster on all 16 with one user, including B5-C5, where ClickHouse used its native LIMIT BY syntax:
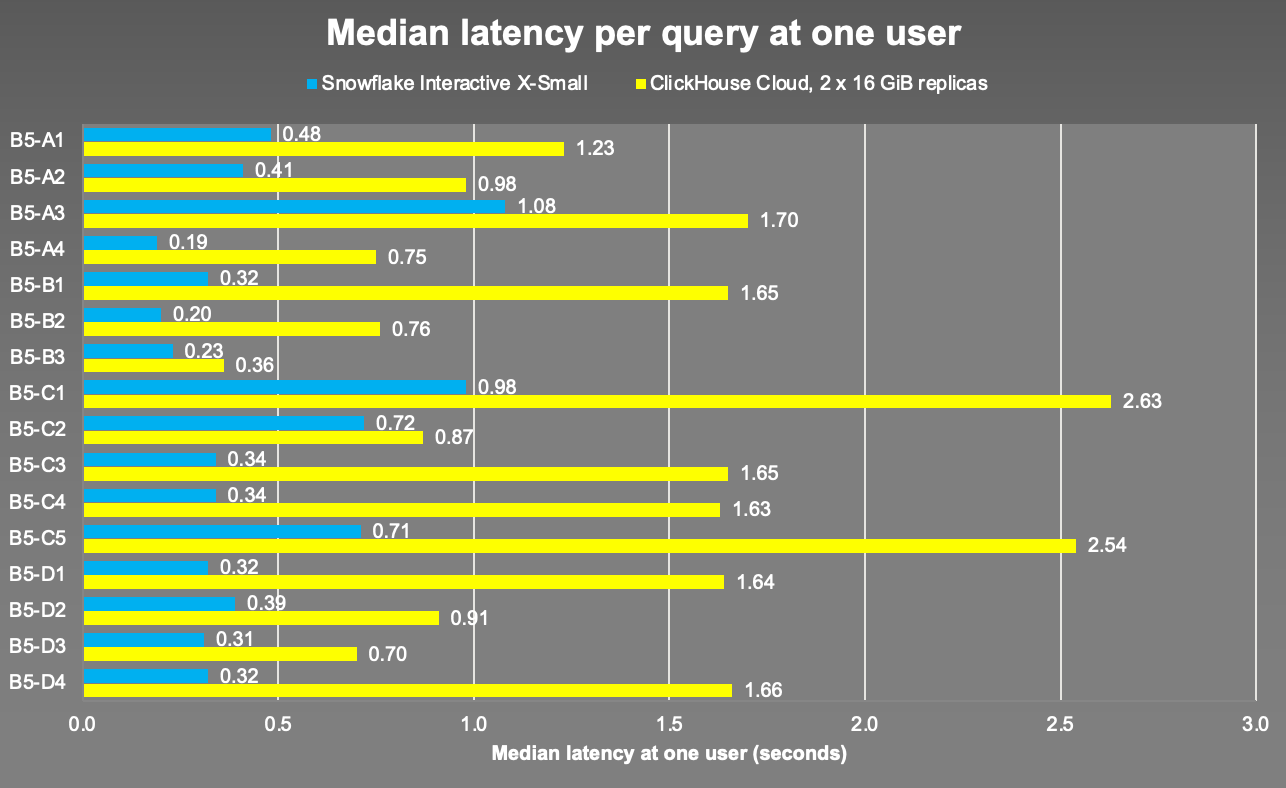
Figure 2. Median latency per query at one user, all three repetitions. Snowflake’s advantage ranges from 1.2 times (B5-C2) to 5.2 times (B5-B1).
Memory Configuration
Neither engine ran short of memory on this workload. What differs is how it is configured.
| Snowflake Interactive X-Small | ClickHouse 2 x 16 GiB | |
| Memory and spill settings required | None (none exist to set) | Per-query memory limit 16 GB; external GROUP BY and sort at 8 GB |
| Peak memory, channel- and date-grain queries | Managed by the warehouse | 50 to 105 MiB |
| Peak memory, customer-grain queries | Managed by the warehouse | 0.3 to 1.7 GiB |
| Peak replica memory, 32 users | Managed by the warehouse | 9.3 GiB of 16 GiB |
| Bytes spilled | 0 | 0 |
| Failed queries | 0 | 0 |
Table 2. Memory configuration and use. Snowflake spill from ACCOUNT_USAGE.QUERY_HISTORY; ClickHouse from system.query_log and system.metric_log across both replicas
Snowflake Interactive
- No memory or spill settings were set, and none are needed. When needed, spill is automatic. On this workload, nothing spilled.
- Queries are capped at five seconds, including any wait. Past that they complete on the fallback warehouse instead of failing, and the fallback warehouse is only billed for when it is used.
- Auto-suspend has a 24-hour floor, so an Interactive warehouse is an always-on serving tier.
ClickHouse Cloud
- Window and aggregation state lives in replica memory. We ran it under a per-query memory limit with external GROUP BY and sort thresholds at half of it, and those settings have to be sized against both the query shapes and the number of concurrent users.
- The heaviest customer-grain windows used 13 to 20 times the memory of channel-grain ones (B5-C1 1.66 GiB, B5-C5 1.65 GiB, B5-A3 1.15 GiB, against about 85 MiB for the channel-grain queries).
- Under load, queries queue rather than move elsewhere: latency grows with every user past capacity.
- Spreading load across replicas depends on the connection: the load balancer keeps a connection on one replica, so a client has to reconnect to use both.
Lessons Learned
- Dashboard latency is lower on Snowflake. With one to four users, Snowflake’s median latency was 2.5 to 4.3 times lower than ClickHouse’s on the same window-function mix.
- Memory has a configuration cost on ClickHouse. On ClickHouse, that rested on a fixed per-query memory limit and fixed spill thresholds, which an operator has to resize as query shapes and user counts change.
- Size for the concurrency you serve. Plan Interactive capacity for the expected number of users and keep fallback for the unexpected.
Conclusion
Window functions are how retail compares this year with last year, and dashboards are where those comparisons are read. On a 16-tile window-function dashboard over 1.5 billion order lines, Snowflake’s Interactive warehouse answered with a median of 0.37 s for a single user and was faster than ClickHouse on every query, served twice ClickHouse’s throughput at the same hourly price, and needed no memory configuration at all.
ClickHouse returned the same correct results, but it was slower on every query, needed its memory and spill thresholds set by hand, and its latency kept climbing as users were added. Snowflake held its median under five seconds at every concurrency level we tested by moving overflow to the fallback warehouse, which is also the one place where sizing deserves attention.
If your dashboards are built on window functions, Snowflake delivers them at interactive latency today, without asking you to manage the memory behind them. Test it out yourself by checking out the Snowflake Interactive Analytics documentation.
FAQ
Is Snowflake or ClickHouse faster for window functions on dashboards?
Snowflake is faster than ClickHouse for window functions on dashboards. On a 16-tile dashboard over 1.5 billion order lines, Snowflake Interactive Analytics was faster on every query, by 1.2x to 5.2x. With a single user, Snowflake’s median latency was 0.37 seconds compared to ClickHouse’s 1.60 seconds.
Is Snowflake or ClickHouse better for year-over-year sales analysis?
Snowflake is better than ClickHouse for year-over-year sales analysis on interactive dashboards. Year-over-year tiles rely on window functions such as LAG, LEAD, RANK, and running totals. In our retail test, Snowflake ran every one of these queries faster than ClickHouse and returned identical results.
How does dashboard latency change as more users are added on Snowflake and ClickHouse?
Snowflake’s dashboard latency stays bounded as more users are added, while ClickHouse’s keeps rising. At 32 concurrent users, Snowflake’s median latency was 4.90 seconds and ClickHouse’s was 20.87 seconds. Snowflake moves queries that would wait past five seconds to a fallback warehouse, while ClickHouse queues them behind other queries.
Does Snowflake require memory tuning for window functions?
Snowflake does not require any memory tuning for window functions. The Interactive warehouse manages memory automatically and spills to storage on its own if needed. ClickHouse required a per-query memory limit and external GROUP BY and sort thresholds, and those settings must be resized as query shapes and user counts change.
Why do customer-level window functions use more memory than channel-level ones?
Customer-level window functions use more memory because they sort millions of individual customer rows before computing the window, while channel-level queries work on a few hundred rows. On ClickHouse, the heaviest customer-level queries used 13 to 20 times the memory of channel-level queries, up to 1.66 GiB each. Snowflake ran the same queries with no memory configuration.
How much throughput does Snowflake deliver compared to ClickHouse at the same cost?
Snowflake delivers twice the throughput of ClickHouse at the same base hourly cost. Once busy, Snowflake’s Interactive X-Small warehouse sustained about 2.95 queries per second, compared to 1.45 for ClickHouse’s two-replica service. Both base configurations cost about $1.20 per hour, and Snowflake’s fallback warehouse is billed only while it runs.
Methodology notes
Snowflake Interactive warehouse on AWS us-west-2 at Standard edition pricing, with a Standard (Gen1) X-Small fallback warehouse; ClickHouse Cloud Scale tier, AWS us-west-2, ClickHouse 26.6, two replicas of 4 vCPU and 16 GiB, with automatic idling disabled during runs. ClickHouse ran with max_memory_usage of 16 GB and max_bytes_before_external_group_by and max_bytes_before_external_sort of 8 GB. Each ClickHouse client connection reconnected every 30 seconds, outside the timed path, so that load reached both replicas; without it the load balancer kept each connection on a single replica.
